Sales Reporting Tool Coming to Blueprint for Agents
A new sales reporting tool will be available for your agency’s designated chief administrator at Blueprint for Agents on July 17, and will give you and your agency a quick snapshot of the products you’ve been selling, and the new business you’ve sold.
The current enrollment listing and the application status listing have traditionally been the two reports used to keep up with sales and servicing of clients, but both were more helpful on the servicing side. The new sales reporting tool is more of a sales dashboard — and was designed to give a quick look at the products you’re selling the most.
Since most agents have an on-boarding process after enrollment, the report will show if the policy has been effectuated and the agent paid. It also features a Top Performers section that will show where your agency and agents ranks among others in the state.
What is defined as a sale?
A sale is classified as a new policy or a returning policy with at least a one-month gap in coverage. It will not be included in the commission month until the member has paid their first premium, and you have been paid your first commission.
Example: You write a new policy for a client effective February 1. The client pays to effectuate the policy on February 17. The timeframe has passed for you to be paid commission for February, so the sale will show up as a March sale.
Helpful tip: In short, this is the month you know your client’s policy was activated and you were paid.
What is the production year?
This is not the calendar year, but instead starts February 1 and ends January 31. For a sale to be included in a production year, it would have to been effective and paid in that period.
Understanding the score
The rank — either as an agency or an agent — is based on the selected time period’s (production year or previous month) total sales, with weight given based on the type of sale. Over-65 medical and Under-65 medical are worth two points each, while dental, vision, Short-Term Blue and stand-alone PDP are each worth one point.
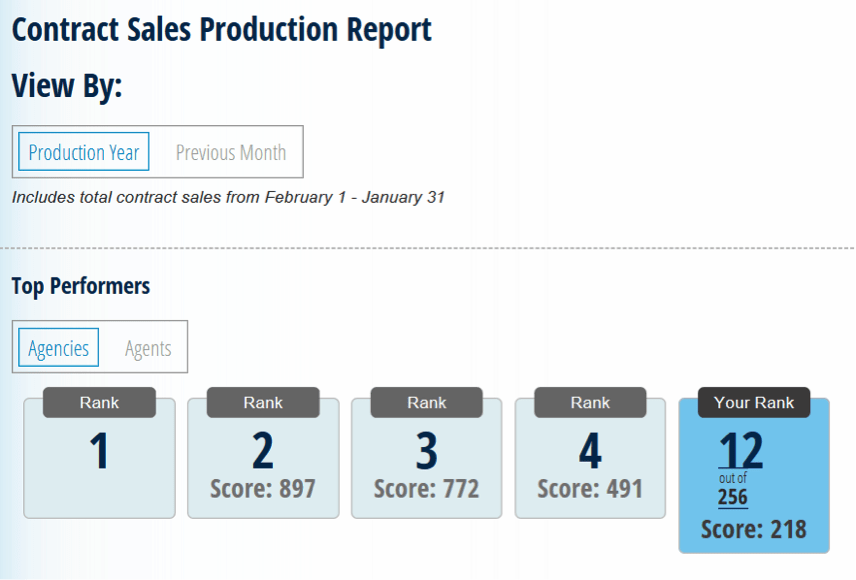
The Top Performers section
This section is intended to show you how your agency compares to other agencies in the state, and how your internal agents compare, too. Outside of your own agency, the actual names of the agents and agencies are anonymous. It was designed to give you a general idea where you and your agents fall in terms of production.
Example: In this example, the agency is ranked 12th of 256 agencies, based on their calculated score for that time period (in this case, the current production year).
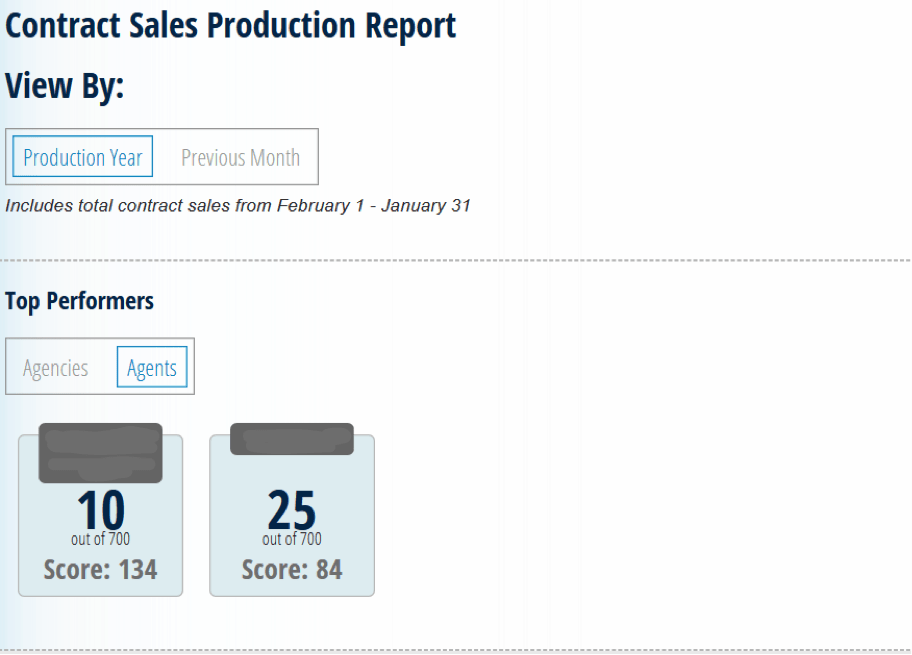
Below, there are two agents within the agency, and it shows their rank out of all agents in the state for that time period (current production year).
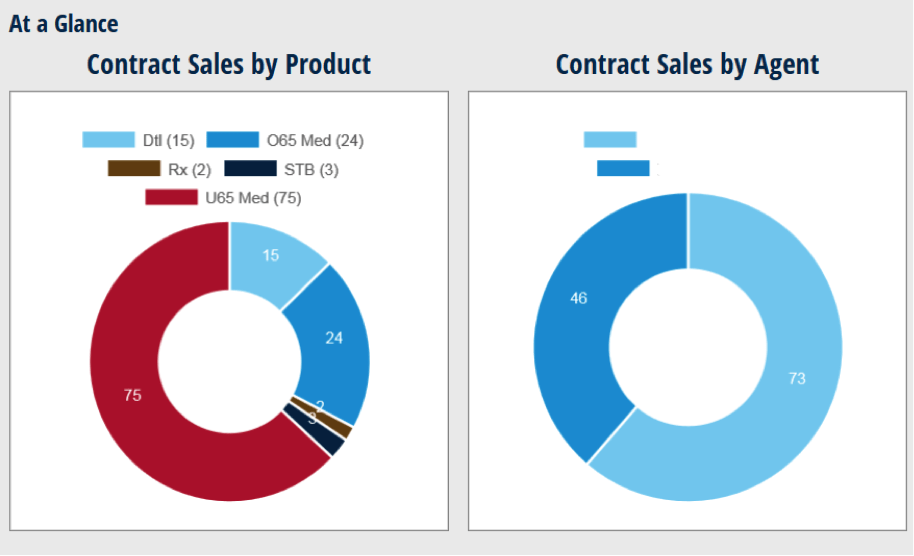
At a Glance
Based on a selected period (either production year or previous month), this shows total sales for the period. The chart on the left shows sales for an agency broken down by category. The chart on the right shows total sales broken down by agents in the agency.
View Sales Report
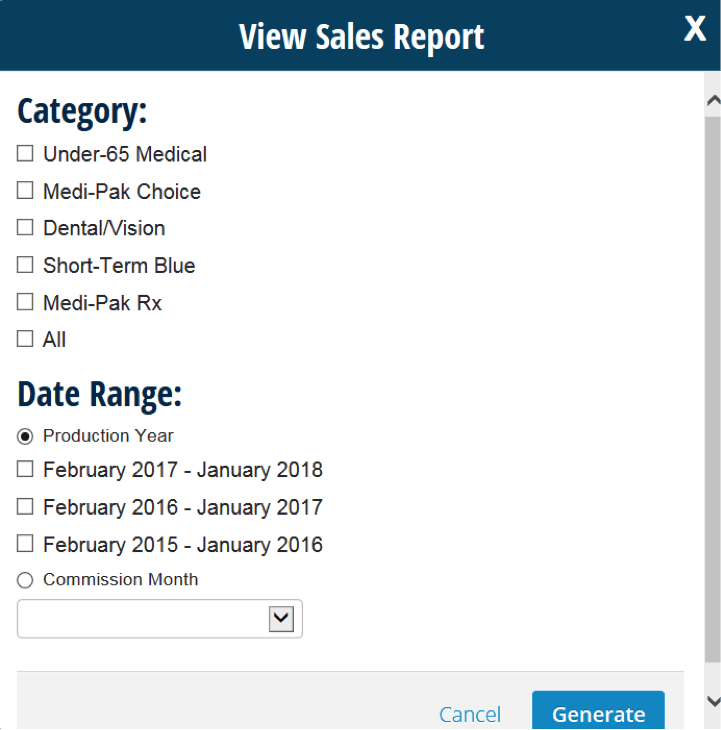
By selecting View Sales Report (see below), you will be able to see a much more detailed range of information and customize the data to your desire.
After selecting View Sales Report, you’ll be prompted to select how you want to view past sales. You first select a category, and you then select a date range. You will have to choose if you want to look at a broader time period (production year) or commission month.
Step 1
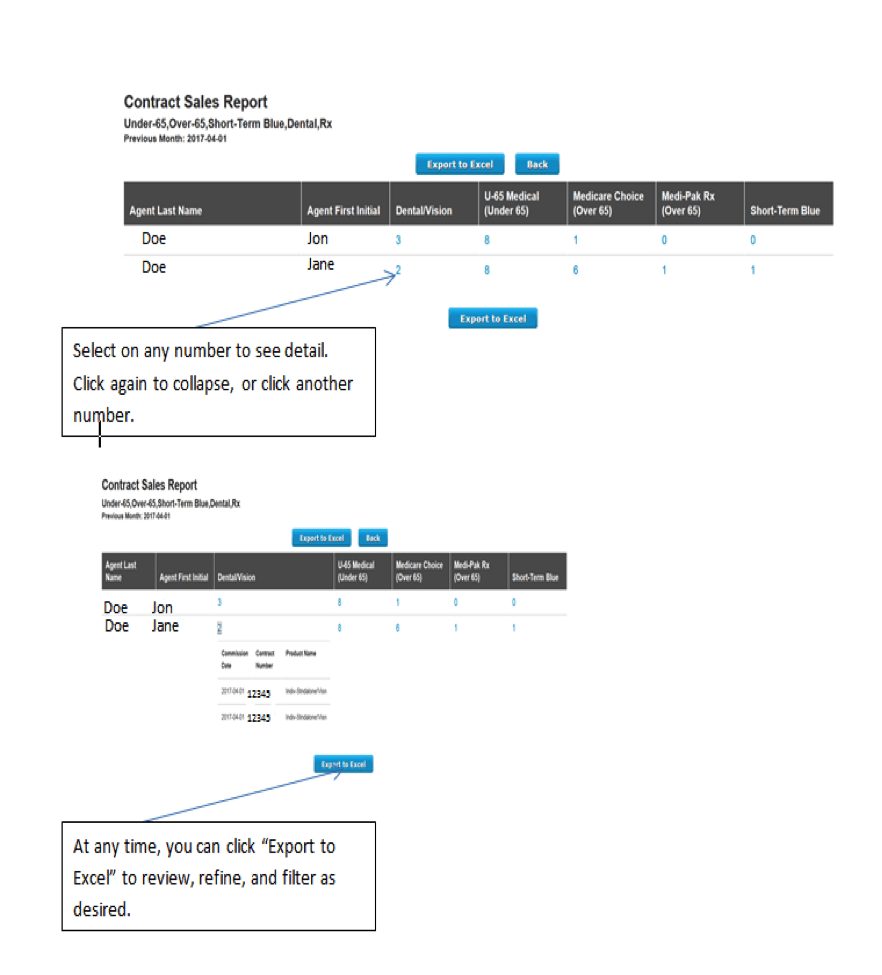
Step 2
Who has access to this tool?
Only the designated chief administrator (in most cases, the same person who has access to the commission statement on Blueprint for Agents) can access this tool. If you wish to assign the chief admin to another person, the agency owner / principal must do so in writing to hcmcroberts@arkbluecross.com.
When are the previous month’s sales updated?
Around the 12th of each month. On or around May 12th, April sales will become available.